2021 in review: Arctic warming and other climate emergencies continue
While 2021 did see positive steps in terms of climate action, it was also a year that brought some disastrous weather events around the world. To mention but a few, February saw a cold freeze in Texas and neighboring states that forced 10 million people to be without power and water. In April in China, huge sandstorms turned the sky above Beijing yellow for a few days. The summer saw extreme heat and wildfires ravage the Mediterranean and nearly 9m hectares (approximately 35,000 sq. miles) of forest burned up in Siberia.
The team at Planet OS started View2020 to document changes in our climate and environmental conditions. View2020 is an interactive dashboard where users can track changes in climate and environmental conditions across the globe and on an individual country-level basis. It relies on datasets accessed from the Planet OS Datahub, and tracks global air pollution and climatology (temperature, precipitation, snow cover) data in near real time. So what does the data have to say about 2021? How did global climatology compare to previous years? Let’s dig into the data.
Looking at climate data
First of all, if we compare the average global temperature between 2021 and the long term average across 1991-2020, we can see that temperatures have increased by 0.37°C (0.67°F). This is a staggering and worrisome increase.
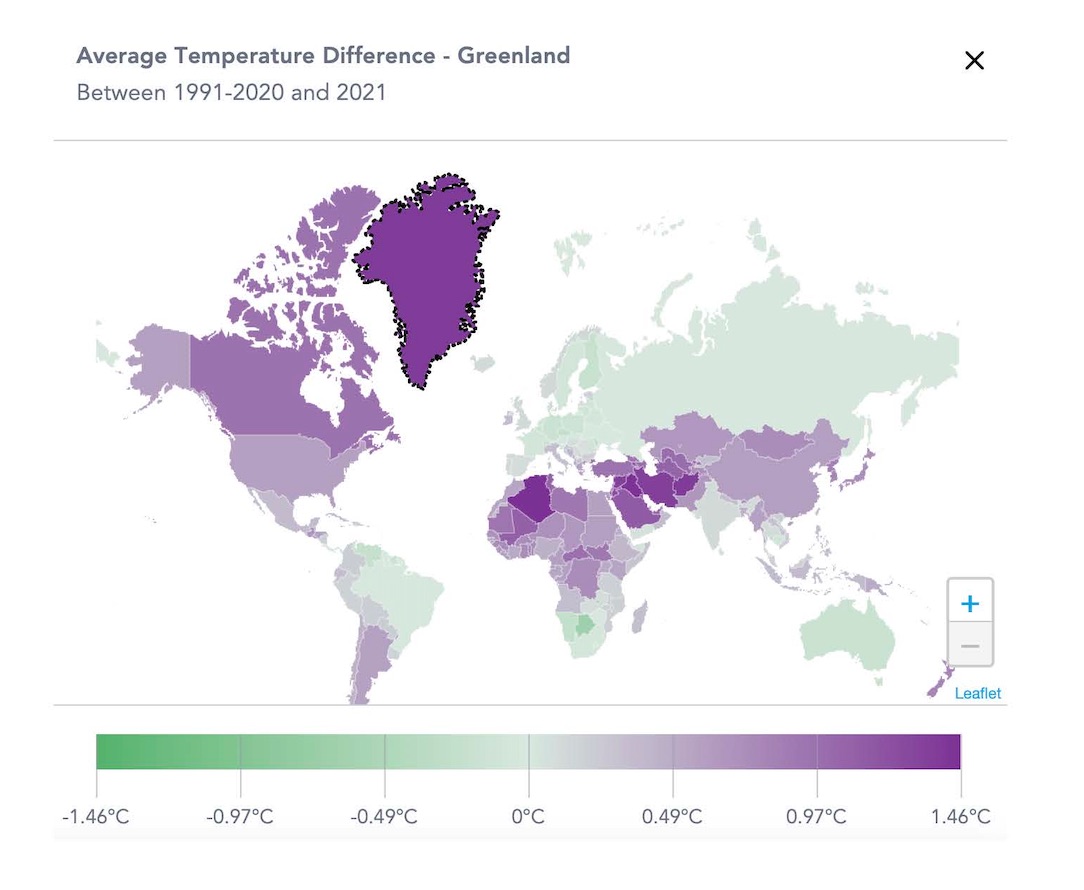
This increase in temperatures is not even across the globe. As predicted in climate models, temperatures in the Arctic have been increasing at twice the rate of the global average. This alarming trend has caused devastating heat waves and wildfires across much of the Arctic region. If we zoom in on Greenland, we can see that average temperatures have increased by an astounding 1.39℃ (2.5°F) comparing 2021 to the 1990-2020 long term average. It is worth bearing in mind that during the same period, global average temperatures increased 0.37°C (0.67°F). The graphic below is an image from View2020 and details temperature change in Greenland.
The warming of the Arctic has ‘feedback loop’ effects. This is because the more the Arctic warms, the less snow cover there is, which in turn leads to less light being reflected away from the earth’s surface. This is known as the “albedo effect.” To dig more into the data, we can see that snow cover in Alaska has decreased by a whopping 21.38% comparing 2021 to the long term average from 1991-2020. Elsewhere in the Arctic circle, in the Russian republic of Sakha, snow cover dropped by 25.18% within the same period. These global trends are nothing less than alarming.
2021 saw some extremely damaging floods and torrential downpours on India’s west coast, as well as in China and in Germany.
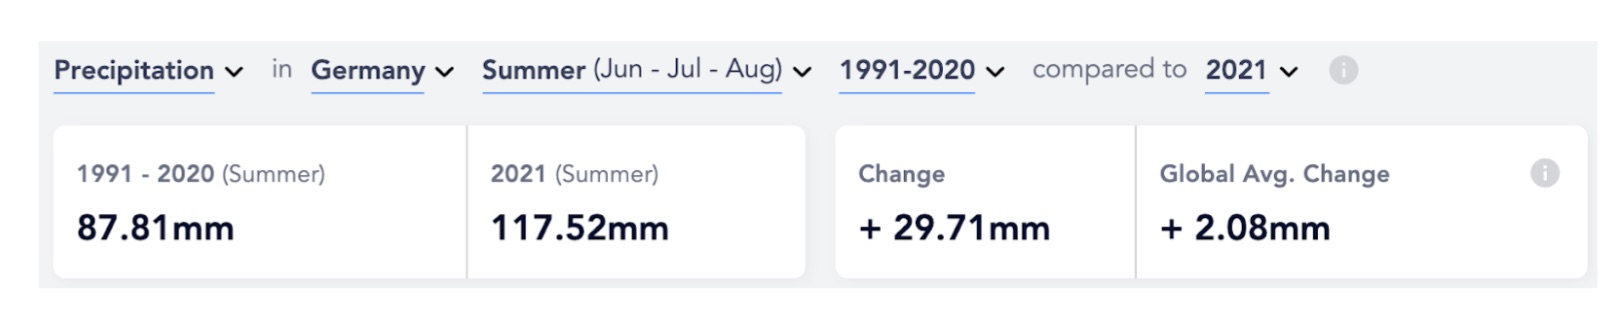
The graphic below shows a staggering increase in summer rainfall in Germany—clocking in at 117.52mm (4.6 in) – 29.71mm (1.17 in) above the long term average 1991-2020.
Germany Average Precipitation Comparing Summer Average 1991-2020 to Summer 2021 (insight from View2020):
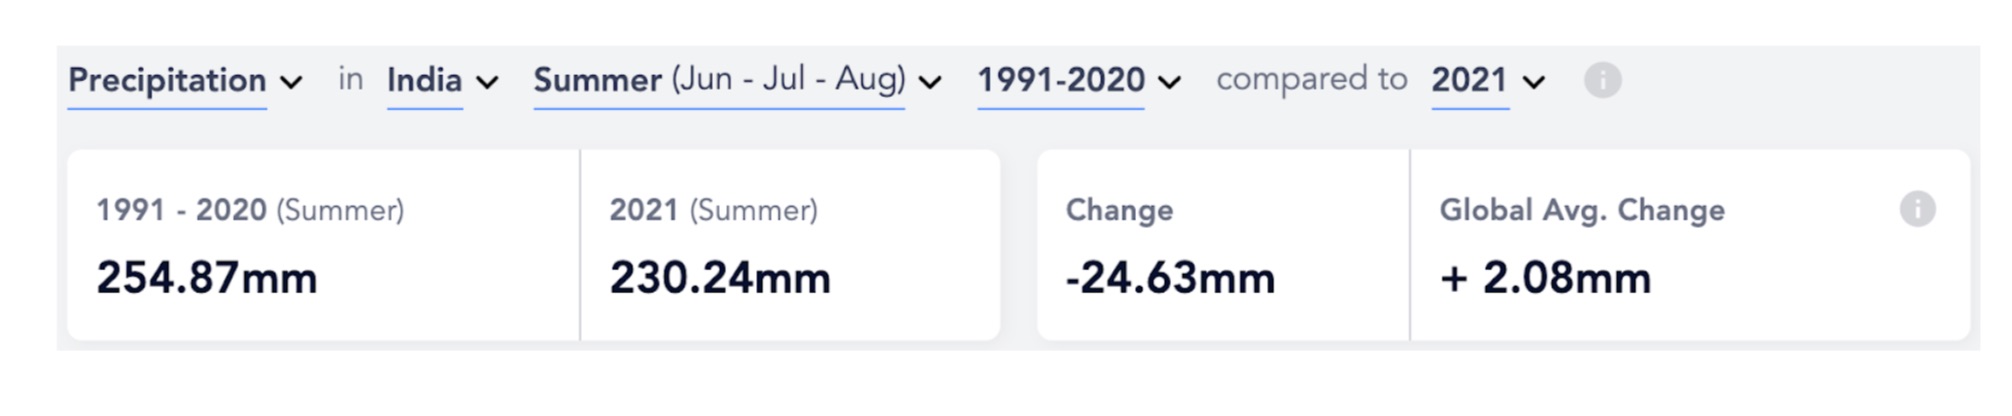
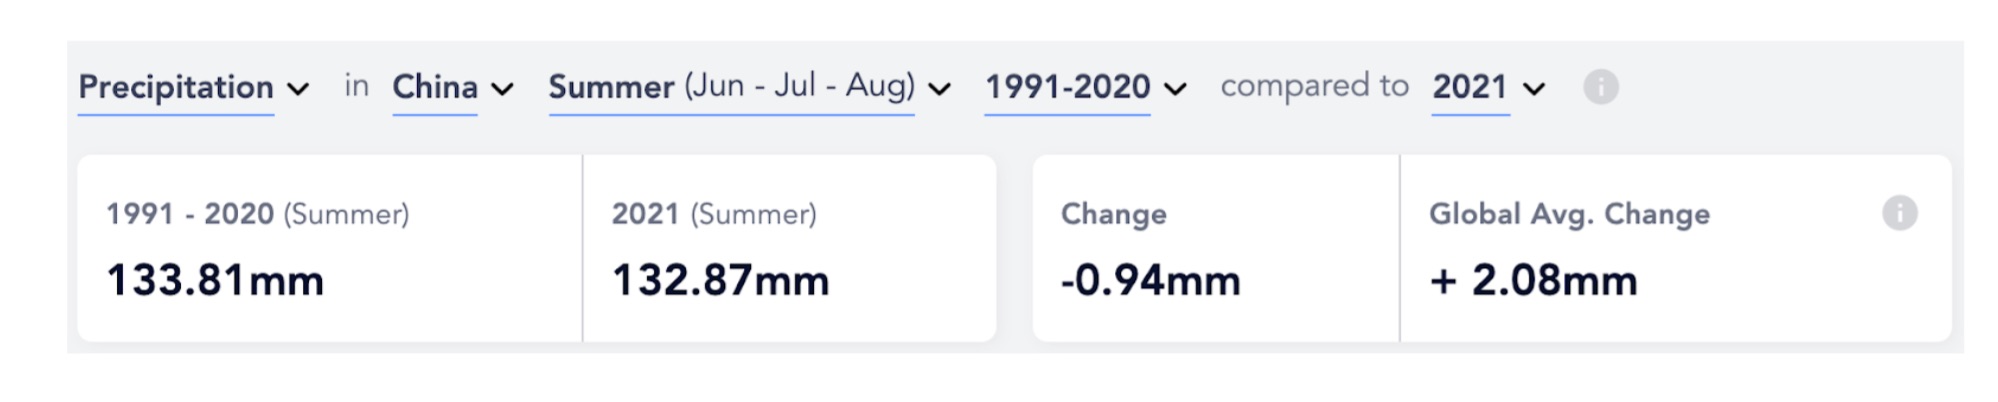
Interestingly, despite extremely damaging floods across India and China, where a year’s worth of rainfall fell in the Hunan Province in China in a single day, average summer precipitation actually decreased in 2021 in both countries, compared to the long term average. In India, precipitation saw a drop of 24.63mm (0.97in) and China saw a drop of 0.94mm (0.04in).
India Average Precipitation Comparing Summer Average 1991-2020 to Summer 2021 (insight from View2020):
China Average Precipitation Comparing Summer Average 1991-2020 to Summer 2021 (insight from View2020):
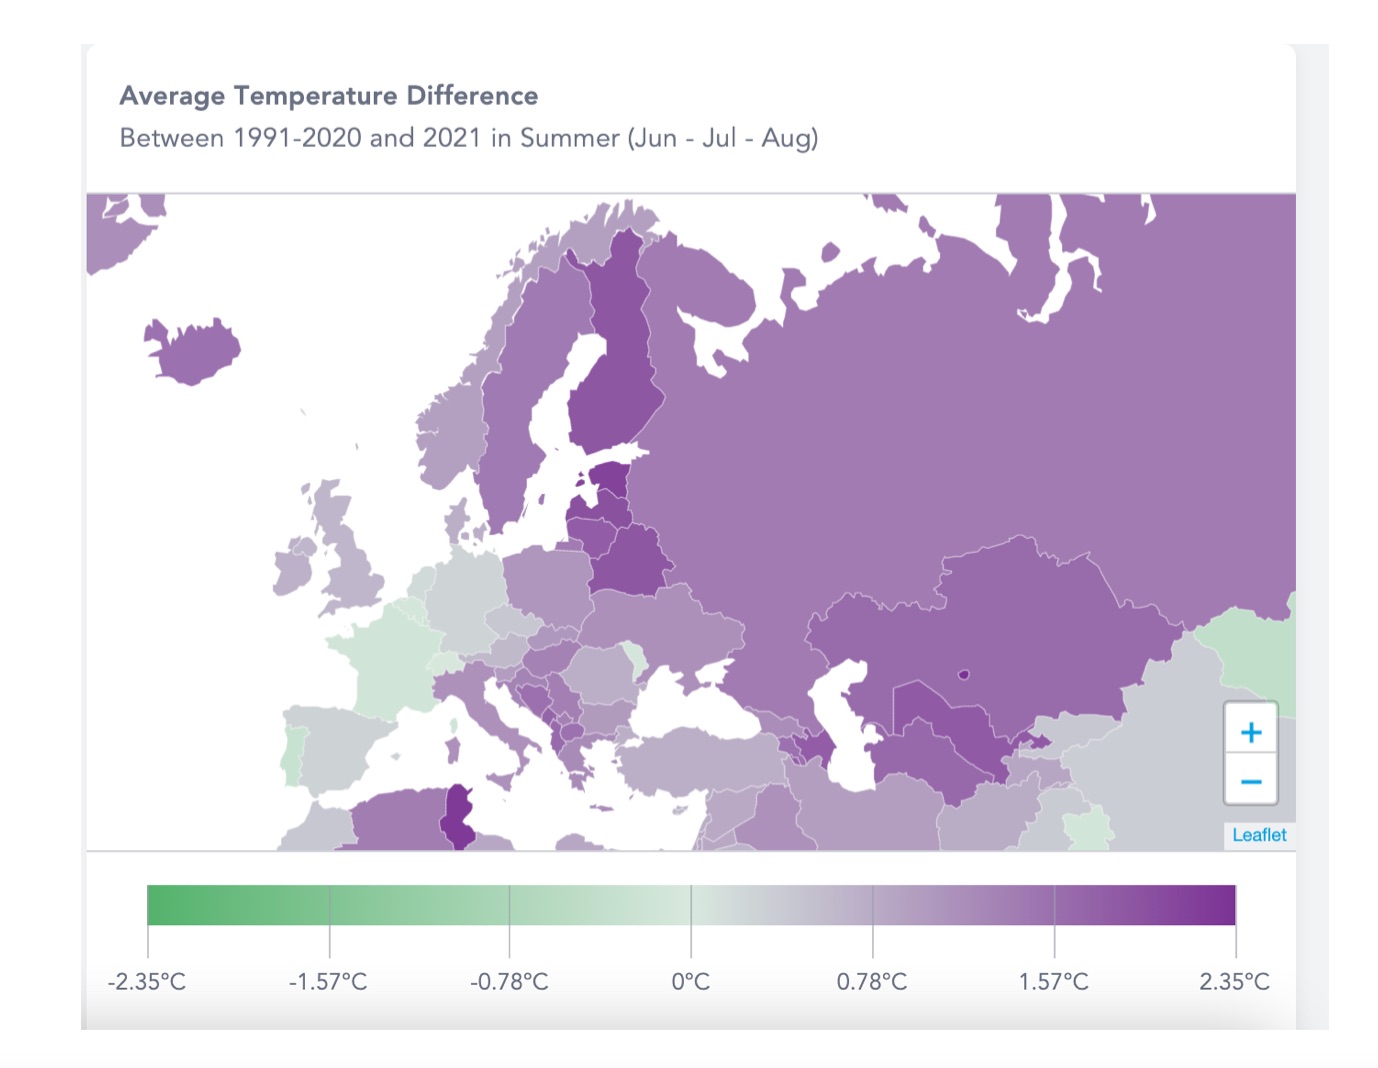
In 2020, Planet OS started to offer smoke forecasts in the High-Resolution Rapid Refresh dataset. While View2020 does not include a smoke forecast, we can look at maximum temperature change to see how extreme heat is affecting certain areas. The Mediterranean was particularly affected by rampant wildfires, with the Greek Prime Minister describing the events as Greece’s “greatest ecological disaster in decades.”
Looking at the graphic below, we can see that much of Europe experienced a very hot summer. Average temperature in Greece was 1℃ (1.8°F) hotter in 2021 than the long term average between 1991-2020, while Spain saw a decrease in average temperature of 0.06℃ (0.11°F). comparing 2021 to the same time period. It is interesting that while some countries in Europe experienced extreme heat, others had a cooler summer.
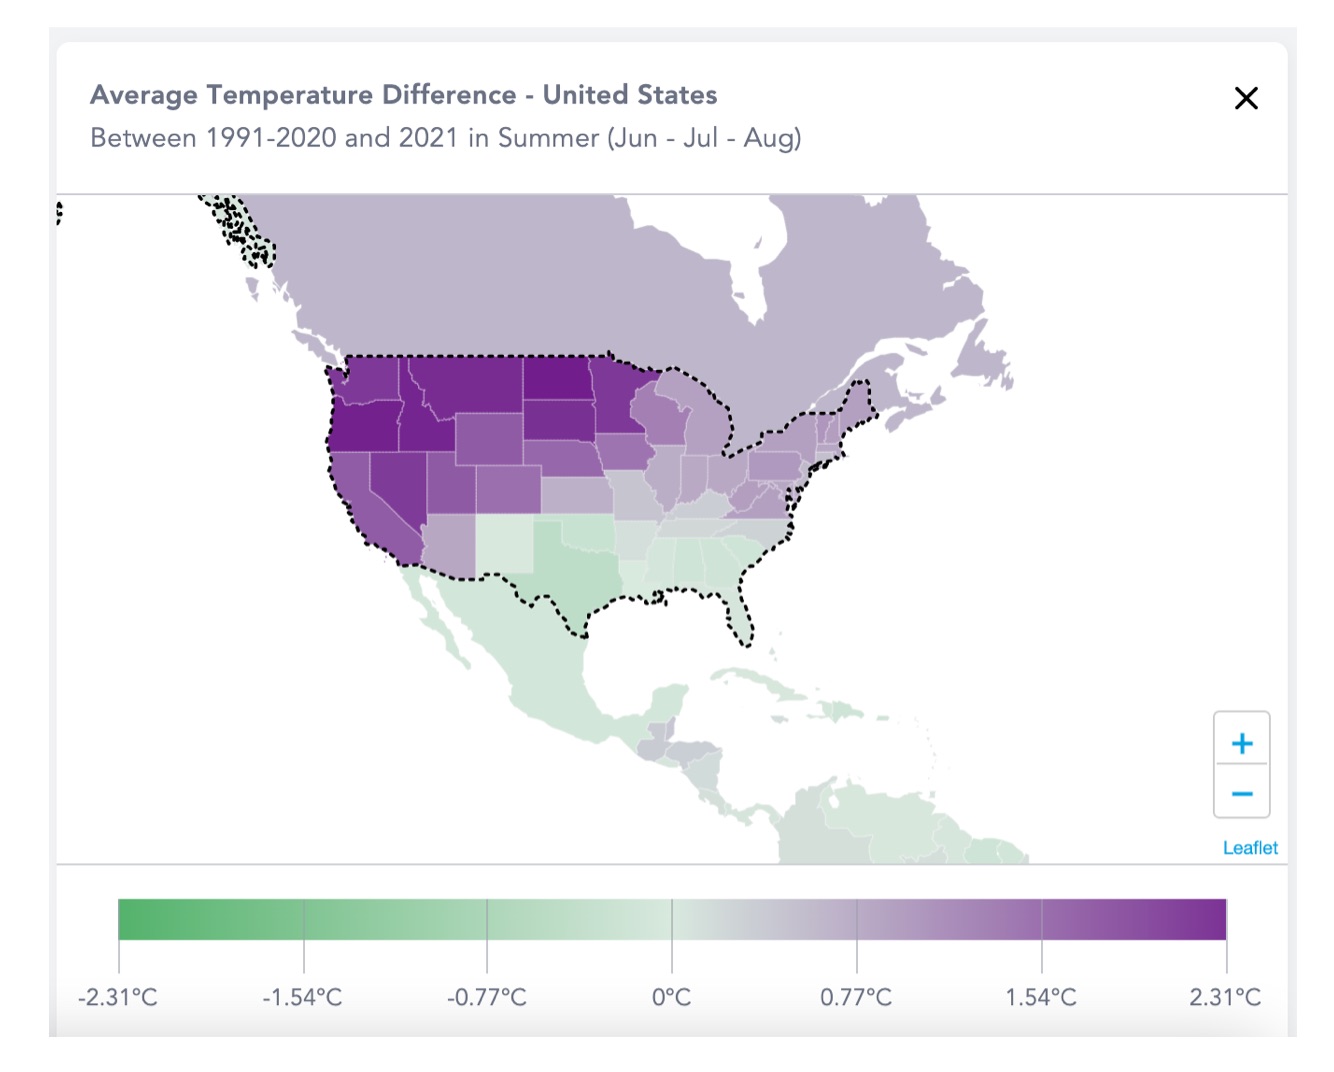
The map below details the USA, comparing 2021 to the Summer long term average 1991-2020. Again, in this graphic we can see that not all states have been affected equally by rising temperatures. The North Western States experienced a particularly hot Summer in 2021, one of the reasons for the worsening drought and increased veracity of wildfires there.
Conclusion
2021 was a momentous year for climate action. The world rallied around COP26 in Glasgow as world leaders came together to secure a landmark deal—the Glasgow Pact—that aims to keep global temperatures below 2.5 degrees C. Some of the core outcomes of the Glasgow Pact were a pledge of $130 trillion in global financing towards the net zero economy, a better framework for reporting climate disclosures within the private sector,and greater checks and balances on nations’ implementation of the Paris Agreement. Among other good news for climate action, 2021 saw the US rejoin the Paris Agreement and the Netherlands ordered Royal Dutch Shell to cut its carbon emissions by 45% by the end of 2030.
However, using View2020, we can see that 2021 was not a reason to be hopeful about changes in our climate. Increasing temperatures globally, flash flooding combined with less overall precipitation, and an Arctic that is quickly losing snow cover are just some of the reasons to be very concerned about our climate. These data points stress the significance of making further efforts to ramp up global action on climate change.

About Eneli Toodu
Eneli Toodu is Intertrust’s Data Integration Engineer for Planet OS Datahub. She is responsible for datasets and projects that are related to Datahub. She is working on environmental datasets for Planet OS Datahub to make using complex weather datasets easier for users. Eneli joined Planet OS already in 2016 as an intern, in 2017 Intertrust acquired Planet OS and since then she has been an employee of Intertrust. Eneli received a M.S., cum laude in Earth Sciences from Tallinn University of Technology.